In today’s world, apps are expected to be fast, always on, and safe. Yet, behind every smooth app is a database that is doing all the hard work—storing user data, handling payments, loading product lists, and more. When that database slows down or fails, your whole app feels broken. Users leave, sales drop, and your team scrambles to fix issues that could have been spotted earlier.
This is where database monitoring comes in. It is like a health check for your data. Instead of waiting for users to complain, you watch key signs in your system and act before things break. With the right setup, you can see slow queries, growing load, and risky trends early. Then, you can fix small issues while they are still easy and cheap to handle.
In this blog, we will walk through what database monitoring is, why it matters for your business, what to track, and how to build a simple and clear monitoring plan. We will avoid heavy tech talk and keep it clear, so even non-technical team members can follow along and take part in the process. If you are planning or updating your app’s data layer, you can also refer to this blog for more context on database choices:
Database Selection Guide – Choose the Best DB for Your App.
What Is Database Monitoring?
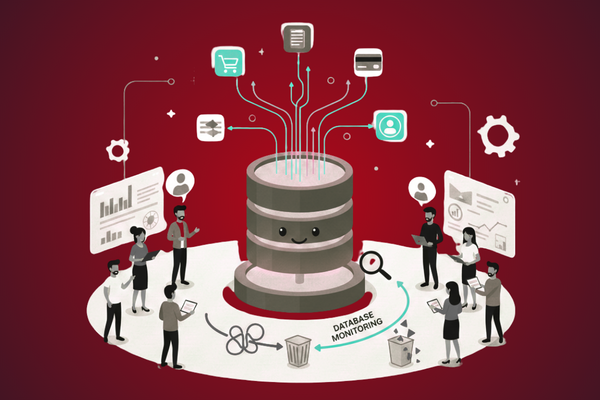
Database monitoring is the practice of watching your database in real time so you can see how it is doing and how it changes over time.
In simple terms, it means:
- Tracking how fast the database answers requests
- Watching how much memory, CPU, and disk it uses
- Checking for errors and failed queries
- Getting alerts when something looks wrong
Instead of guessing what might be slow or broken, your team uses real numbers and simple charts to see what is going on.
Why It Matters
Your database is the center of your app. If it is slow, everything feels slow. If it fails, your app goes down. Monitoring lets you:
- Avoid downtime by catching early warning signs
- Improve speed by finding slow parts before users do
- Plan growth by knowing when you need more resources
- Increase trust with more stable and predictable systems
Good database monitoring turns surprise outages into planned fixes.
Common Database Problems You Can See Early
Most serious database issues do not come out of nowhere. Many grow slowly and show clear signs days or even weeks ahead.
1. Slow Queries
A “query” is a request to the database, such as “get all orders for this customer.”
Common causes of slow queries:
- Missing or wrong indexes
- Queries that return too much data
- Poorly written joins between tables
Early signs you can monitor:
- Average query time goes up
- More queries are “long-running”
- CPU usage on the database server keeps rising
With monitoring in place, you can see which queries are the slowest and fix them before they cause user-facing delays.
2. Locking and Blocking
Databases often “lock” rows or tables while making changes. That is normal. But if too many locks build up, queries have to wait, and the whole system slows down.
What to watch:
- Number of blocked queries
- Lock wait times
- Transactions that stay open for too long
Spotting growing lock times early allows your team to tune queries or change how updates are done.
3. Resource Exhaustion (CPU, Memory, Disk)
Your database runs on a server (or in the cloud) that has limits:
- CPU: High, steady CPU may mean heavy queries or not enough compute power
- Memory (RAM): If memory is full, the database may swap to disk and slow down
- Disk: Running out of disk space can cause crashes or failed writes
With steady database monitoring, you can see resource usage trends and upgrade or optimize before you hit the wall.
4. Connection and Pool Issues
Apps connect to databases through “connections.” These are often pooled and reused.
Problems appear when:
- The app opens too many connections
- The pool size is too small or too large
- Connections are not closed properly
Symptoms:
- Connection timeouts
- “Too many connections” errors
- Sudden spikes in response times
Monitoring connections over time helps you adjust pool settings and avoid random slowdowns.
Key Metrics to Track
To catch problems early, you do not need to track everything—only the most important signals.
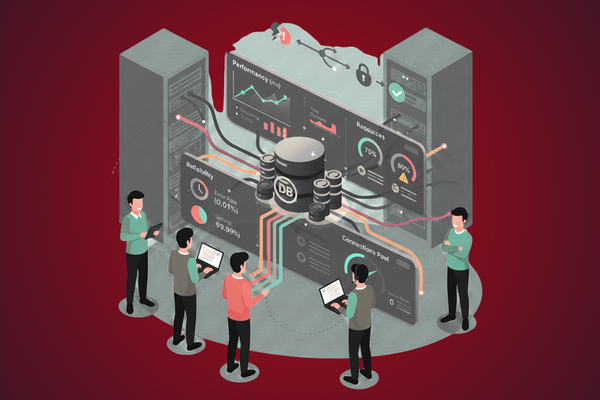
Here are core metrics that almost every team should include in their database monitoring setup:
Performance Metrics
- Query latency: How long queries take on average
- Slow query count: How many queries cross a set time limit (e.g., over 1 second)
- Throughput: Number of queries or transactions per second
These metrics tell you if the database is keeping up as your traffic grows.
Resource Metrics
- CPU usage: Shows how hard the server is working
- Memory usage: Tells you if your cache and buffers are sized well
- Disk I/O and space: How fast data is read/written and how much disk is left
These numbers help you balance cost and speed.
Reliability Metrics
- Error rate: Share of queries that fail
- Replication lag (if you use replicas): Delay between primary and replica servers
- Uptime: Time the database is healthy and available
These metrics show how safe and stable your data layer is.
Tools and Approaches for Database Monitoring
There are many tools you can use. The right option depends on your size, stack, and budget. Yet, the general approaches are similar.
1. Built-In Database Tools
Most databases (like PostgreSQL, MySQL, SQL Server, and others) come with:
- System views for stats (e.g., slow query logs)
- Basic performance dashboards
- Configurable logs
These are handy for teams getting started and can give strong insights without extra cost.
2. APM and Monitoring Platforms
Application Performance Monitoring (APM) tools and cloud monitoring platforms can:
- Track database metrics with the rest of your stack
- Correlate slow queries with slow API or page requests
- Send alerts to Slack, email, or SMS
They are often easier to use, with ready-made dashboards and alerts.
3. Custom Dashboards
For teams with specific needs, you can:
- Collect metrics with open-source agents
- Store them in a time-series database
- Build dashboards in tools like Grafana
This route gives more control, but it takes more work to set up and maintain.
A Simple Strategy to Detect Problems Early
Instead of trying to “monitor everything,” start with a simple, clear plan.
Step 1: Define What “Healthy” Means
Work with both tech and business roles to define:
- Acceptable response time (e.g., 95% of queries under 300 ms)
- Target uptime (e.g., 99.9%)
- Error rate that is acceptable (e.g., below 0.1%)
These numbers become your baseline.
Step 2: Pick a Few Core Metrics
Focus on:
- Query latency
- Slow query count
- CPU and memory usage
- Disk space
- Error rate
This keeps your dashboard clean and easy to read.
Step 3: Set Smart Alerts
Do not alert only when things are already broken. Instead:
- Alert when query latency climbs above your baseline for a set time
- Alert when disk space is below a safe threshold (for example, 20% left)
- Alert when error rates spike
Use “warning” and “critical” levels so your team can act early.
Step 4: Review Trends Regularly
Once a week or once a sprint:
- Check trends over days and weeks
- Identify slow, steady increases in load or resource use
- Plan index changes, hardware upgrades, or query fixes
This habit turns monitoring into a routine, not a panic button.
Working Across Teams
Database health is not just a “DBA job” or a “dev job.” When you make database monitoring visible across the company, everyone can help.
- Product owners see how new features impact speed
- Developers learn from slow queries and write better ones
- Ops and DevOps teams plan capacity with real data
- Leadership understands the link between stability and user trust
Shared dashboards and simple, clear reports can help bridge the gap between tech and business.
Conclusion: From Firefighting to Predictable, Stable Systems
When teams think about databases, they often focus on setup: choosing a vendor, designing tables, setting up backups. While these steps matter, they are only the start of the journey. The real test comes months later, when traffic grows, features change, and real users depend on your system every hour of the day.
Without structured monitoring, teams are forced into a reactive, firefighting mode. Users report slow pages. Payments fail at busy times. Reports take too long to run. Each problem seems new, but in many cases, the signs were already in the system: a slow growth in query time, a steady rise in CPU usage, or a jump in errors after a release.
A solid database monitoring approach turns this around. By tracking a focused set of metrics, you gain a clear and honest picture of how your data layer behaves as the business grows. You can separate one-time spikes from slow, worrying trends. You can connect database health to business outcomes, such as checkout success, search speed, or support tickets.
Most importantly, a good monitoring setup supports better decisions. It tells you when to optimize queries, when to add indexes, and when it is time to upgrade your server or move to a different architecture. It helps your developers ship with more confidence, knowing that if something goes wrong, you will see it quickly and can roll back or fix it fast.
For many teams, the next step is simple: start small. Choose a few core metrics, set clear thresholds, and make your first dashboard. Share it with your team. Review it often. As your comfort grows, add more detail and automation. Combine monitoring with a thoughtful database selection and design process.
By shifting from guesswork to data, and from panic to planning, you build systems that are not just fast today, but ready for tomorrow’s load and tomorrow’s users. That is the real value of monitoring: not just solving problems, but seeing them before they happen and quietly steering your product toward long-term stability and trust.
FAQs
- What is database monitoring?
It is the process of tracking database health, speed, and errors so you can prevent problems. - Why is it important?
It helps avoid downtime, slow apps, and data issues by catching warning signs early. - Which metrics should I track first?
Start with query time, error rate, CPU, memory, and disk space. - Do small apps need monitoring too?
Yes. Even small apps benefit from early insight as they grow. - Can non-technical people understand monitoring reports?
Yes, if dashboards use clear labels, simple charts, and plain language.


